The Bill That Should Have Spiked
WebOustaou's first customer is a seasonal restaurant. Traffic in August is roughly four times what it is in February: same site, same pages, same menu, just a lot more people looking at it. Every intuition about serverless pricing says the platform bill should trace that curve.
It didn't. Consumption stayed essentially linear across the year, and the peak season is invisible in it. That isn't luck, and it isn't Vercel being generous. It's a consequence of a decision made before the traffic arrived: treating the cache layout as part of the architecture rather than as an optimization pass to run once something gets slow.
Serverless Bills Follow Invocations, Not Visitors
The reframe that makes the rest of this make sense: on Vercel, a request served out of the edge cache never reaches your code. No function boots, no function runs, no function is billed. The unit of cost is the invocation, and the number of invocations is not the number of visitors: it's the number of requests that miss every cache in front of your compute.
So the design question stops being "how do I make this page fast" and becomes "at which layer does this particular request stop, and what has to be true for it to stop there". Once you frame it that way, the cache stack turns into a real architectural artifact, with owners, TTLs, and an invalidation contract, instead of a scattering of revalidate exports nobody can reason about.
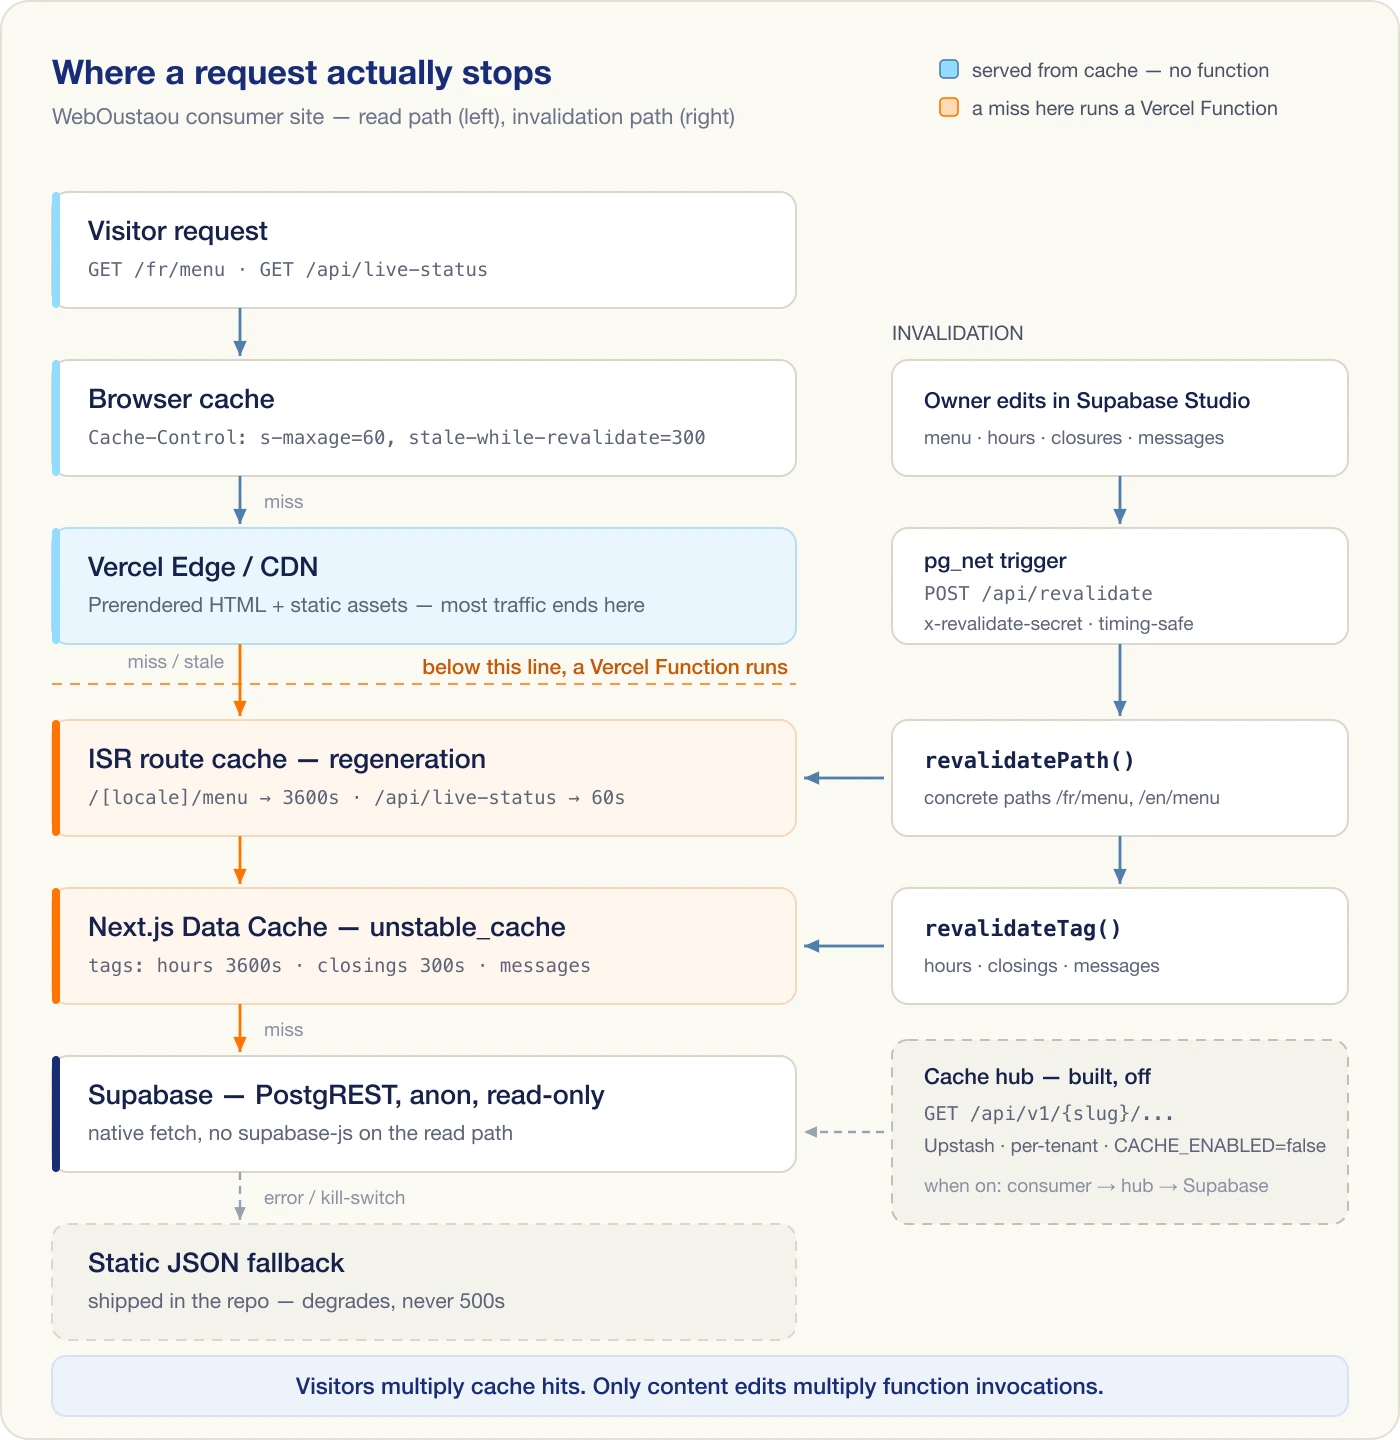
The Stack, Layer by Layer
Browser. The open/closed badge is served by /api/live-status with Cache-Control: public, s-maxage=60, stale-while-revalidate=300. A visitor refreshing the page, or bouncing between menu and home, doesn't generate a second request at all.
Vercel Edge / CDN. Pages are prerendered per locale through generateStaticParams. This is where the overwhelming majority of a busy Saturday actually lands: HTML and static assets, served from a POP, with nothing of ours executing. Four times the visitors means four times the edge hits, and edge hits are not the expensive line item.
ISR route cache. /[locale]/menu carries revalidate = 3600; /api/live-status carries revalidate = 60. This is the first layer where a miss costs something: a stale route triggers a regeneration, and a regeneration is a function invocation. Crucially, that regeneration happens once per path per window, no matter how many people are waiting on it.
Next.js data cache. Underneath the page render, unstable_cache wraps each Supabase read with an explicit tag and TTL: hours at 3600s, closings at 300s (keyed per locale, all locales sharing the tag), messages alongside them. So even a regenerating page doesn't necessarily hit the database.
Supabase, then static JSON. The origin is anonymous, read-only PostgREST over native fetch. Behind it sits a static JSON fallback shipped in the repo, reached either by a SUPABASE_READS_DISABLED kill-switch or by the read simply throwing. The site degrades to yesterday's hours; it does not degrade to a 500.
Cache the Data, Not the Response
/api/hours is declared export const dynamic = 'force-dynamic', which looks like a mistake in an article about caching. It isn't. The route handler is deliberately uncached, and the caching is pushed one level down into unstable_cache inside hours-storage.ts.
The reason is invalidation. A cached response is invalidated by time, or by a path. A cached data read is invalidated by a tag, and a tag can be named after a domain concept. When someone edits opening hours, the event that occurred is "hours changed," not "the URL /api/hours changed." Tagging the read means the same revalidateTag('hours') busts it whether it was consumed by an API route, a server component, or something that doesn't exist yet. Caching the response would have bought a slightly cheaper request and given up the ability to invalidate on the thing that actually happened.
Invalidation Is the Hard Half
TTLs alone force a bad trade: short enough that edits appear quickly, long enough that you aren't regenerating constantly. Both goals point in opposite directions, and you end up picking a number you're unhappy with.
A webhook removes the trade. Postgres pg_net triggers on products, opening_hours, closures, and messages POST to /api/revalidate with a shared secret in x-revalidate-secret, compared with timingSafeEqual. The handler maps the table to the right invalidation: menu writes bust the menu paths, hours writes bust the home paths plus revalidateTag('hours') and revalidateTag('live-status'), and so on.
The interesting part is what that does to the TTL. Once a webhook exists, the TTL is no longer the mechanism that makes edits appear, it's the backstop for the webhook failing. So you set it by asking "how stale can we tolerate being if the webhook silently breaks," which is an hour for a menu, rather than "how fast must an edit show up," which would have been seconds. Same freshness, a fraction of the regenerations.
One Policy Table, Three Layers
The TTLs above appear in more than one place. The unstable_cache call needs a revalidate and a tag. The client-side query layer needs a staleTime. The webhook receiver needs to know which tables map to which domain so it can bust the right thing. Written independently, those three end up drifting, and the failure mode is silent: nothing crashes when a client considers data fresh that the server considers stale.
So they aren't written independently. A single module, cache-policy.ts, exports one table: for each cache domain (menu, hours, closures, messages, live status, posts, happenings, offers), a ttlSeconds, a staleTimeMs, and the list of Supabase tables whose mutations invalidate it. All three layers read from that one object, and the webhook maps body.table back to a domain through the same table.
It has no dependency on React, on TanStack Query, or on Next.js. Just constants and three helpers. That constraint is deliberate: a policy module that imports a framework can only be read by that framework, and the whole point is that an edge function or a separate service can import it later without dragging anything along. Which turns out to matter, for reasons the last section gets to.
Two Bugs Worth an Article on Their Own
revalidatePath with a dynamic segment doesn't do what it looks like. Calling revalidatePath('/[locale]/menu') does not reliably invalidate pages that were prerendered via generateStaticParams. The webhook fired, returned 200, logged success, and the page kept serving the old price anyway. The fix is to loop over the locales and revalidate the concrete paths: /fr/menu, /en/menu. An invalidation path that reports success while doing nothing is worse than not having one, because it removes the pressure to look.
Never cache a degraded response. /api/live-status returns s-maxage=60 only on the healthy path. The kill-switch response and the error response both return no-store. Without that, a single Supabase blip gets pinned into the edge cache and every visitor sees "hours unknown" for the full TTL: a two-second outage amplified into a minute-long one. Cache headers are usually written on the success branch and copied to the others; the error branch is exactly where the copy is wrong.
Proving It Instead of Believing It
A cache you haven't tested in both directions is two bugs waiting: one where it doesn't hold, and one where it never lets go. scripts/verify-cache.sh runs both against a local Supabase and a production build.
Test one disables the webhook, changes a price in the database, and asserts the page does not update, proving the cache actually holds. Test two enables the webhook, changes the price again, and asserts the page does update within the timeout, proving trigger, pg_net, secret check, and revalidatePath all connect end to end. The script also refuses to run if x-nextjs-cache is missing from the response headers, because ISR doesn't exist under next dev and the whole test would otherwise pass vacuously against a dev server.
What the Season Actually Did

That's function duration on Vercel, broken down by project, week by week through the ramp into high season. The blue band is darius-pizza-site, the customer site, the one whose visitors quadruple. It holds at roughly fifteen to twenty minutes of function time every single week, and it is the flattest thing on the chart. It's also 56% of everything shown, which is the part worth sitting with: the busiest property on the account is the one contributing the least variance.
Everything stacked above it is the platform's own code under active development: the marketing site, the admin app, the site template. That's what makes the later bars taller. The growth on that chart is me deploying, not customers arriving. (The last bar is a partial week.)
The shape follows from the design rather than from the traffic. Function invocations are roughly bounded by the number of cached paths multiplied by how often each window expires, plus the invalidations triggered by owner edits, plus cold misses. Visitor count does not appear in that expression anywhere.
An owner editing hours three times a day produces the same invalidation work in February as in August. The menu regenerates on its own schedule regardless of who's reading it. What quadrupled in high season was edge hits and bandwidth, the layers that were designed to absorb exactly that. The compute layer never found out it was summer.
The Hub That's Built and Switched Off
Everything above describes one site. The arithmetic changes with the second one. N customer sites each caching independently means Postgres sees N × M uncached reads at worst, against connection-pool limits that are very real. Invalidation fragments too: a database webhook that has to notify every consumer site directly needs every consumer's URL, so provisioning a tenant becomes a config edit in a place nobody remembers to edit.
The designed answer is a central read hub: GET /api/v1/{slug}/{endpoint} in front of one mutualized Upstash Redis, keyed tenant:{id}:{endpoint}. One Redis for N customers, one TTL governance table, one permanent webhook URL that DELs the affected keys and fans out to each consumer's /api/revalidate. WebOustaou becomes a connection multiplexer in front of Postgres instead of every site queuing at the door.
It's built. And it's also switched off: CACHE_ENABLED=false in production, true in local and CI. Prod still reads Supabase directly, because with one live customer the hub buys mutualization nobody needs yet, and costs an extra network hop plus a new single point of failure for every read. The honest version of "we have a cache hub" is: the code exists, the tests run against it, and the flag stays off until a second tenant makes the trade worth taking.
That's the part I'd defend hardest. Building the layer early was cheap: it reuses the same cache-policy.ts TTLs, and the tag formatter already namespaces by customer, so the template was hub-ready before the hub even existed. Turning it on early would have bought latency and an outage surface in exchange for a scaling property that doesn't apply yet. Those are different decisions, and conflating them is how architectures get heavy.
What It Costs
This isn't free, and the costs are real ones. Every layer is a staleness window you've agreed to, and someone has to own that number per data type. The webhook is a dependency that can fail quietly, which is why the TTL backstop is not optional. There are more caches than there are places to look when one is wrong, and "the site is showing old hours" has at least four possible culprits before you reach the database. And the static fallback is a promise: if nobody maintains it, "degrades gracefully" is a comment, not a behavior.
The point isn't that caching is clever. It's that the cache stack is a load-bearing part of the architecture, with the same claim on being designed, documented, and tested as the schema is. Deciding it up front is what turns a seasonal traffic spike into a non-event.
