
Motivation
EASA CS-23 certification documents are long, dense, and difficult to navigate. They are distributed mainly as large PDFs, with deeply nested structures, cross-references, and multiple amendments.
This project started from a simple frustration: understanding and navigating these documents efficiently is unnecessarily hard.
CS-23 Graph is my attempt to turn regulatory text into something structured, explorable, and usable.
Two-Part Project
The project is deliberately split into two distinct parts:
- Data extraction and structuring
- Visualization and exploration
Each part can exist independently, but they are designed to work together.
Part 1 — From PDF to Structured Data
The first challenge was converting the CS-23 documents into usable data.
This involved:
- Scraping and cleaning complex EASA PDF files
- Removing headers, footers, and layout noise
- Detecting hierarchical structures (Subparts, CS numbers, paragraphs, AMC)
- Assigning stable identifiers to each requirement
- Exporting the result to JSON and XLSX formats
The output is a structured dataset that preserves the regulatory hierarchy while being usable by humans in xlsx format and by other programs in its JSON format.
Data Model
The extracted data follows a strict hierarchy:
- Subpart
- CS section
- Requirements and sub-requirements
- Acceptable Means of Compliance (AMC)
Each node includes:
- A unique identifier
- Clean textual content
- Regulatory source references
- Optional metadata for later processing
This structure enables analysis, filtering, and visualization without reprocessing the original PDFs.
Part 2 — Visualizing the Regulation
Once the data was structured, the next step was to make it explorable beyond a simple spreadsheet.
The visualization layer allows:
- Navigating CS-23 as a collapsible tree
- Switching between subparts
- Expanding or collapsing requirements on demand
- Grasping the overall structure at a glance
This makes relationships and scope immediately visible in a way static PDFs cannot.
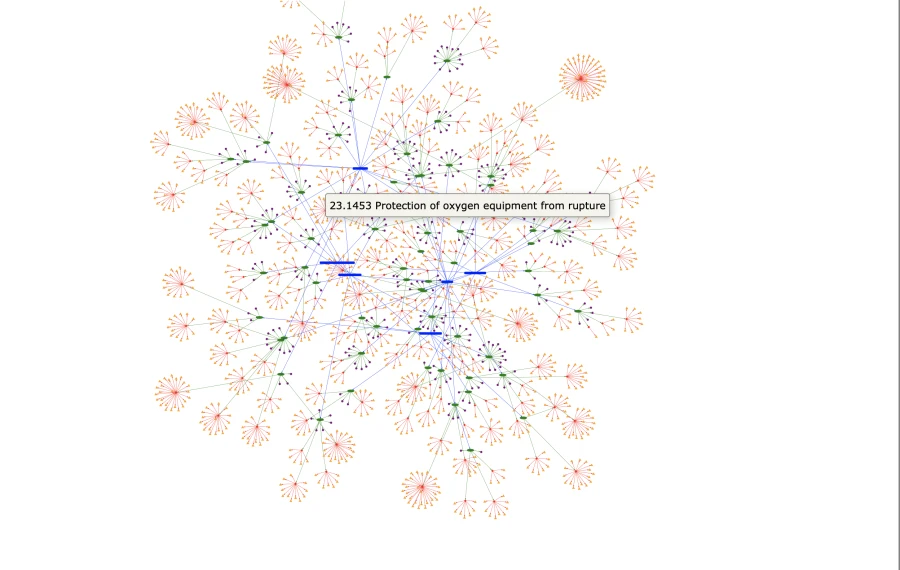
Alternative Graph View
In addition to the hierarchical tree, the project includes a graph-based view.
This representation:
- Shows relationships between sections and AMCs
- Uses force-directed layouts to reveal structure
- Allows filtering and neighborhood highlighting
It is particularly useful for spotting cross-references and dense areas of regulation.
Technical Stack
- Language: Python
- PDF processing: PyMuPDF, pdfplumber
- Data: pandas
- Export formats: JSON, Excel
- Visualization: D3.js, vis.js
- Graph modeling: NetworkX
The tooling was chosen to favor control and transparency over abstraction.
Constraints and Tradeoffs
- PDF structure is inconsistent and fragile
- Heavy reliance on pattern detection and heuristics
- High initial complexity before any visible result
- Visual clarity versus completeness in large graphs
These constraints shaped both the extraction pipeline and the visualization design.
What This Project Explores
A field that concerns aviation itself less than:
- Transforming unstructured information into structured systems
- Designing data pipelines for difficult sources
- Building visual tools to reason about complexity
It sits at the intersection of data engineering, tooling, and visualization.
Outcome
The project produces:
- Structured CS-23 datasets usable in other tools
- Interactive visualizations that make regulation explorable
- A reusable approach for similar regulatory documents
It demonstrates how complex, real-world documentation can be transformed into usable systems.
Takeaway
CS-23 Graph is a personal project driven by curiosity and frustration. It reflects how I approach complex problems: break them down, structure them carefully, and build tools that make them understandable.


